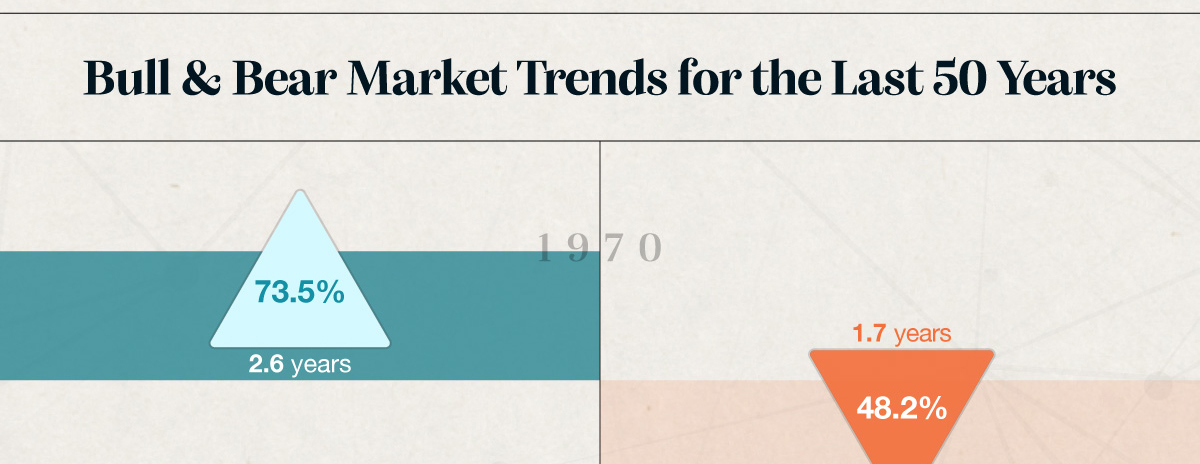
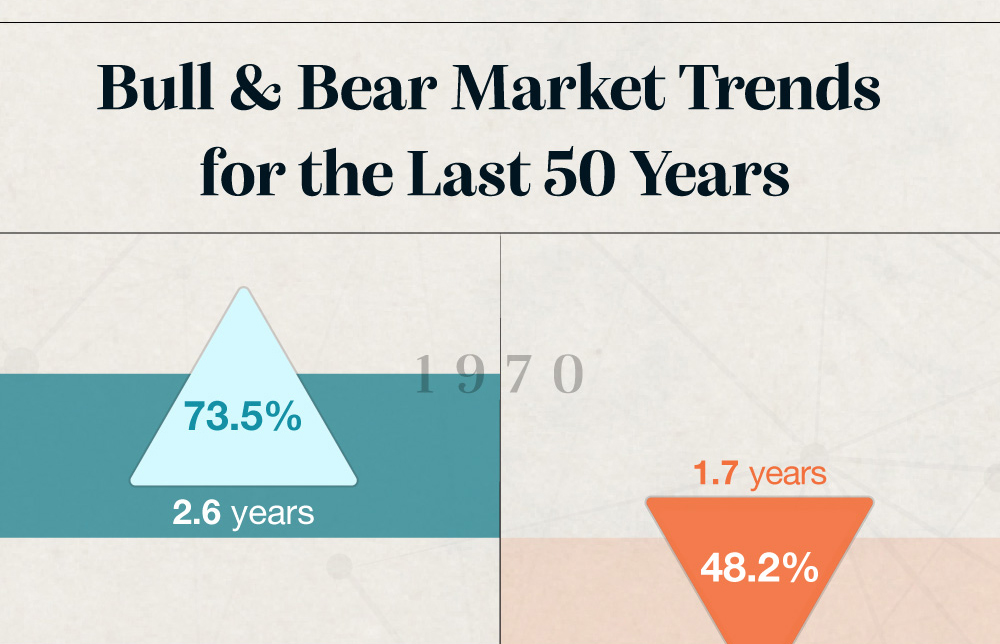
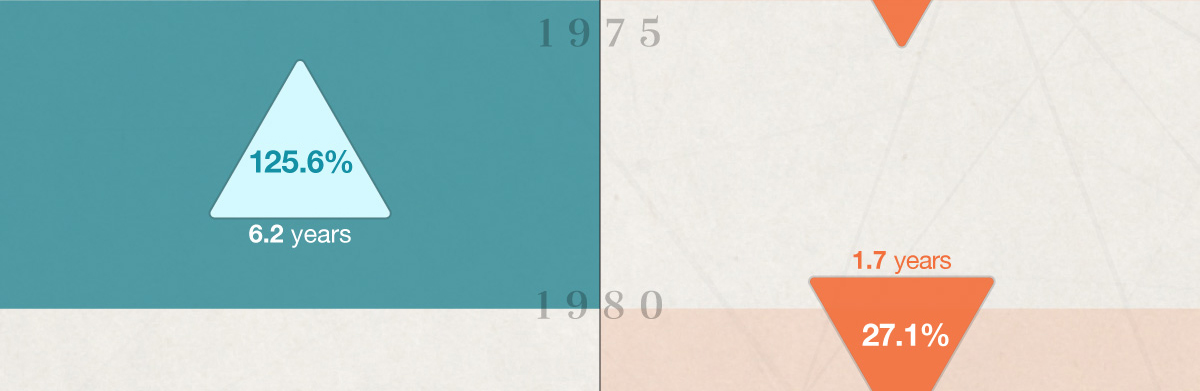
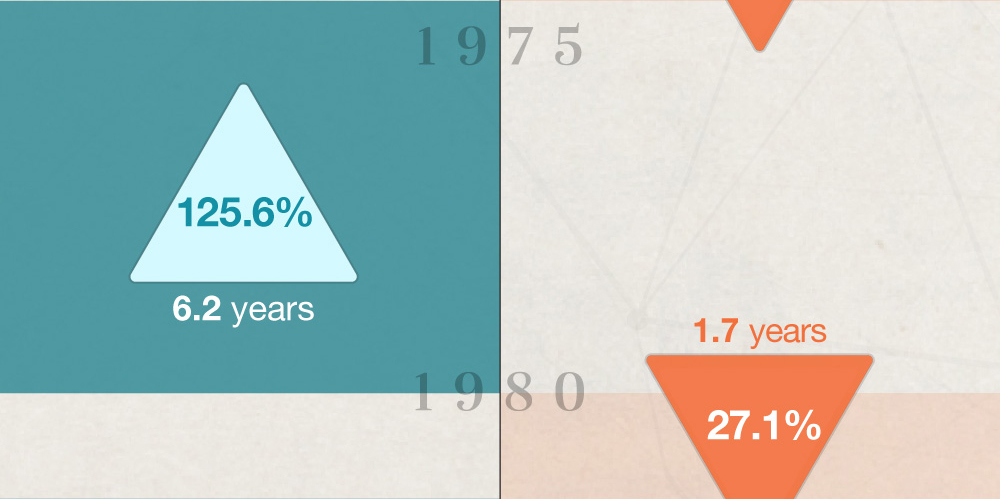
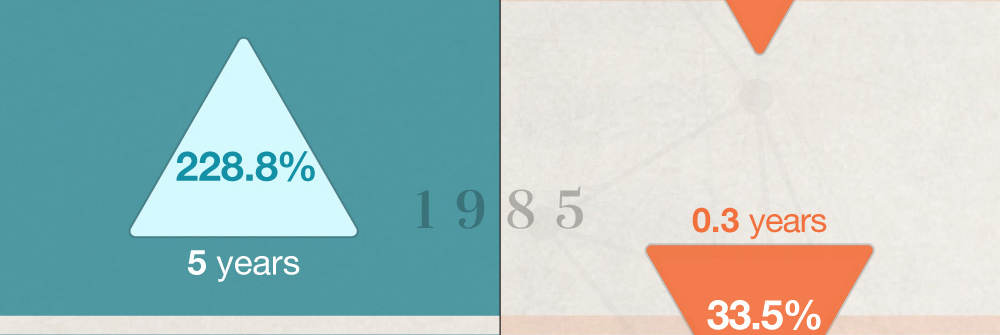
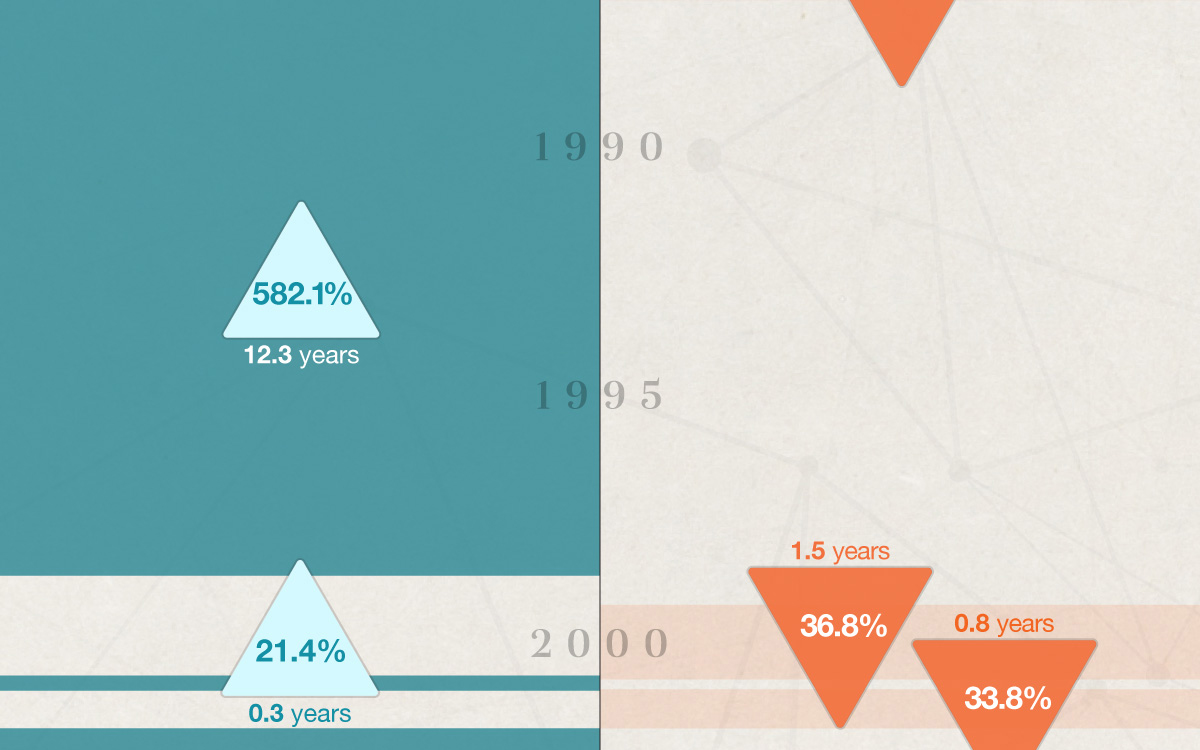
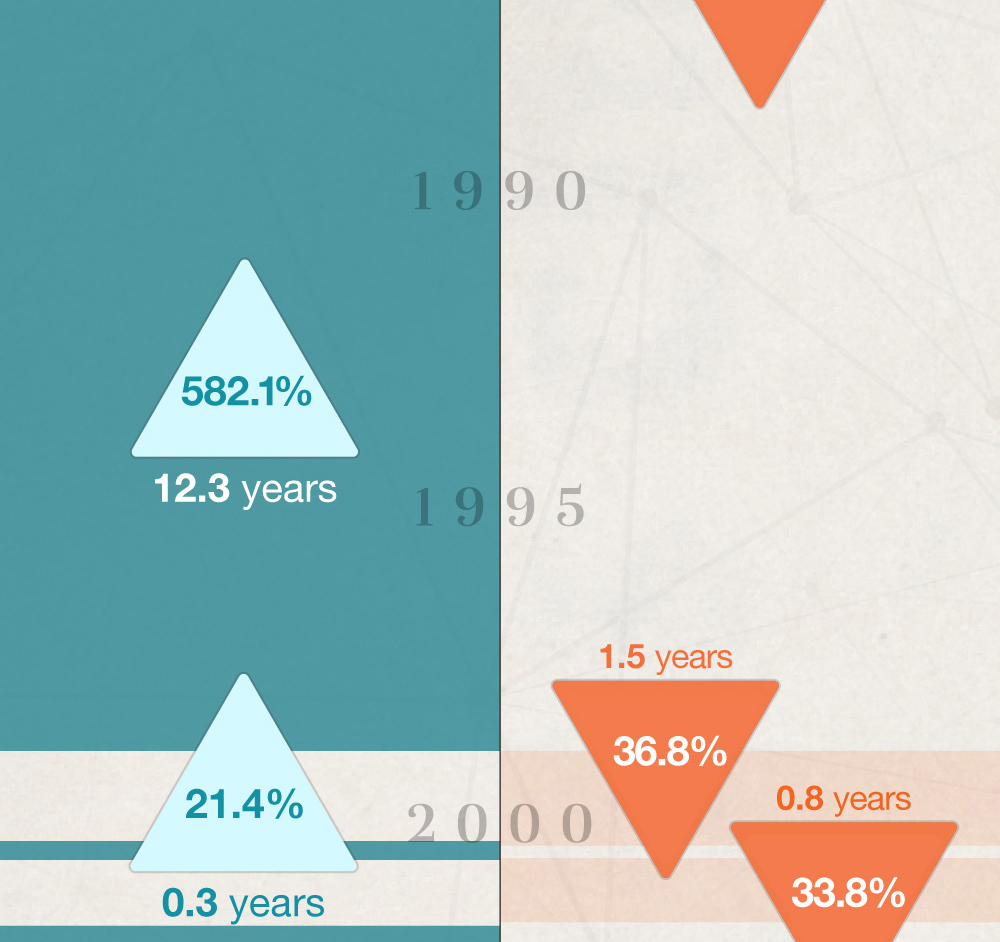
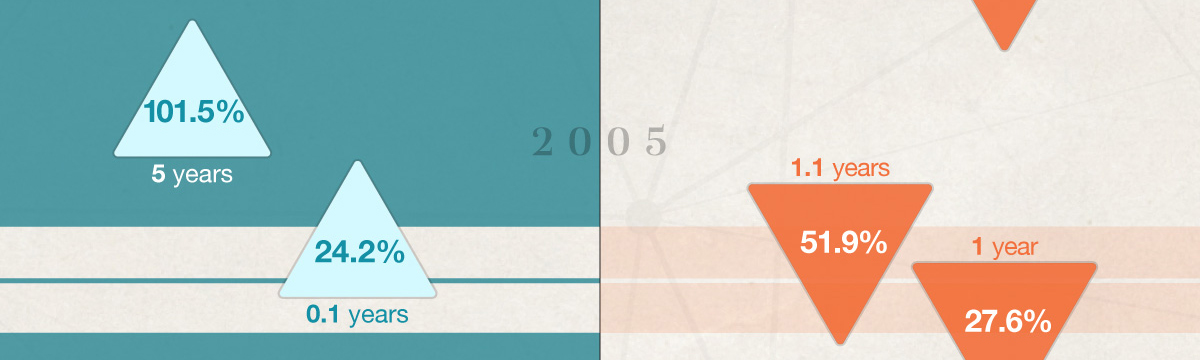
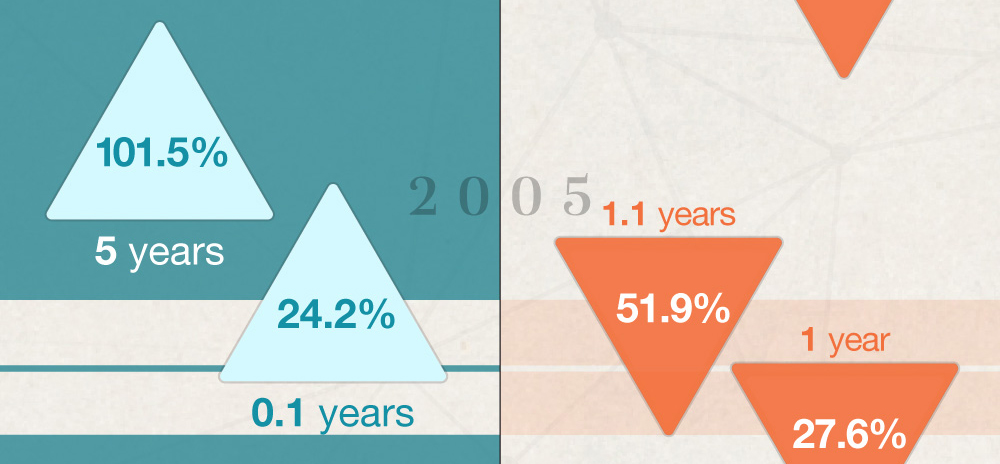
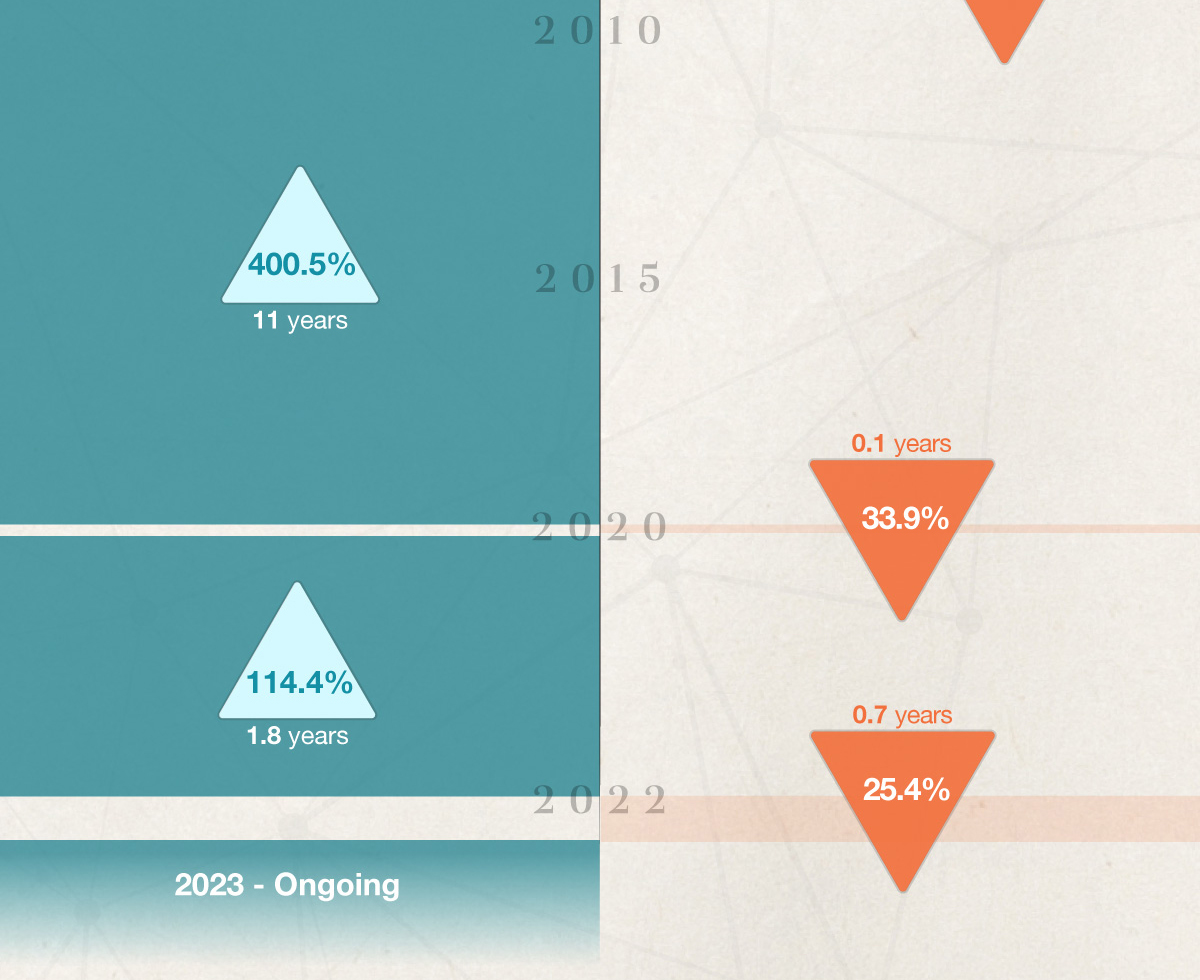
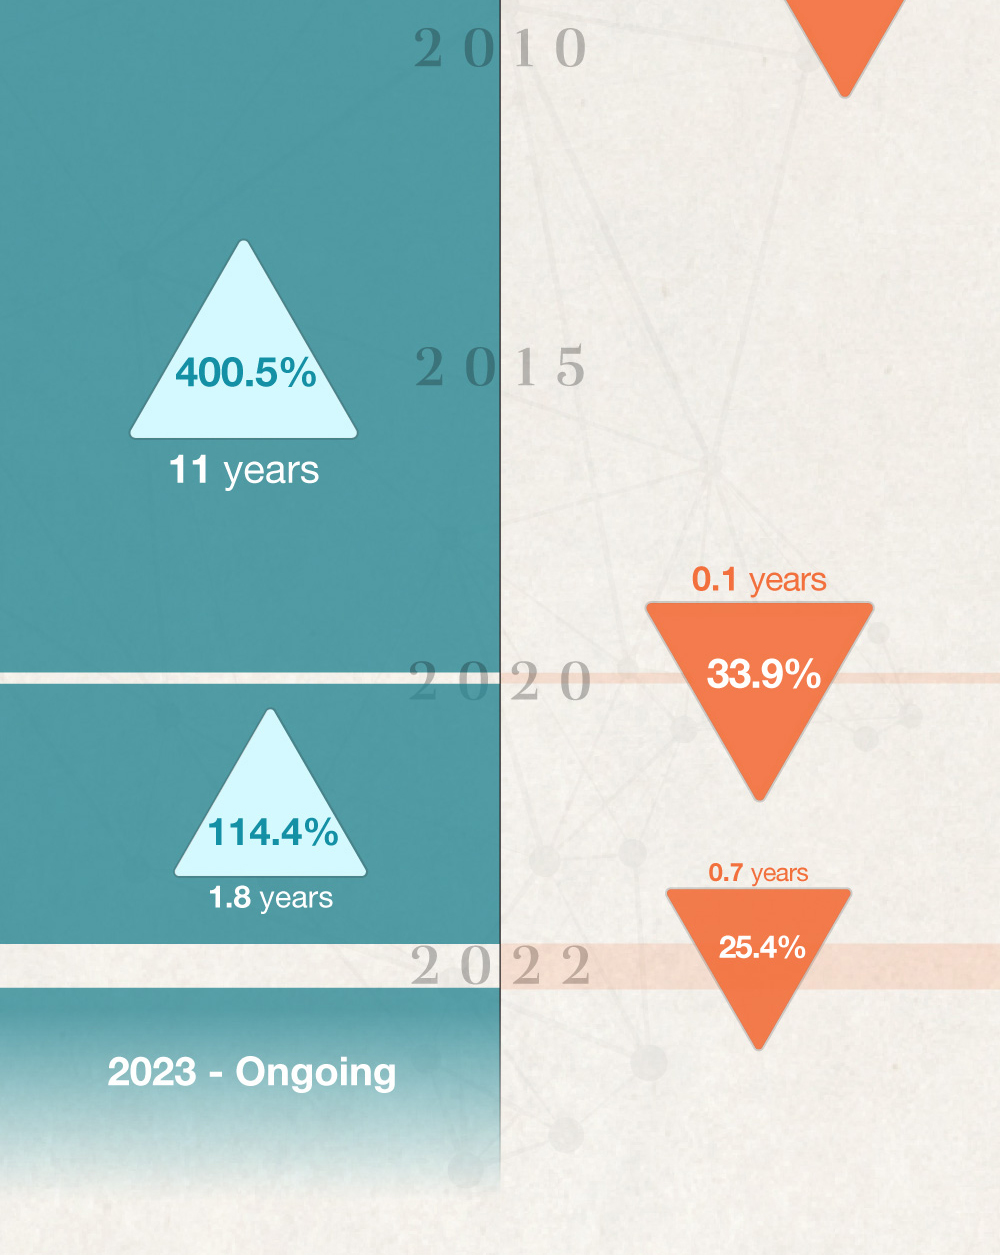
Bull & Bear Markets: A Timeline


Do you need to enroll in Medicare Part D? Read this article to learn more about whether you need this coverage

Do you have intellectual property? Consider how you might include your IP into your estate strategy in this detailed article.

Ready for retirement? Find out why many are considering encore careers and push your boundaries into something more, here.